The Préfontaine Portfolio includes all of Stéphane Préfontaine’s personal and corporate accounts as well as those of the Fondation Préfontaine-Hushion during the reference period. This portfolio serves as a model for the accounts of all Préfontaine Capital clients. The portfolio is made up of Stéphane Préfontaine’s best investment ideas and consists of around 20 to 30 common shares of publicly traded companies, with no restrictions on market capitalization size, economic sector, or geography. Essentially all the stocks in the accounts of Préfontaine Capital clients are also present in the Préfontaine Portfolio.
Terms of consultation
Once you have accepted these conditions, you will be redirected to the Préfontaine Portfolio returns page.
Please check all boxes:
Préfontaine Portfolio*
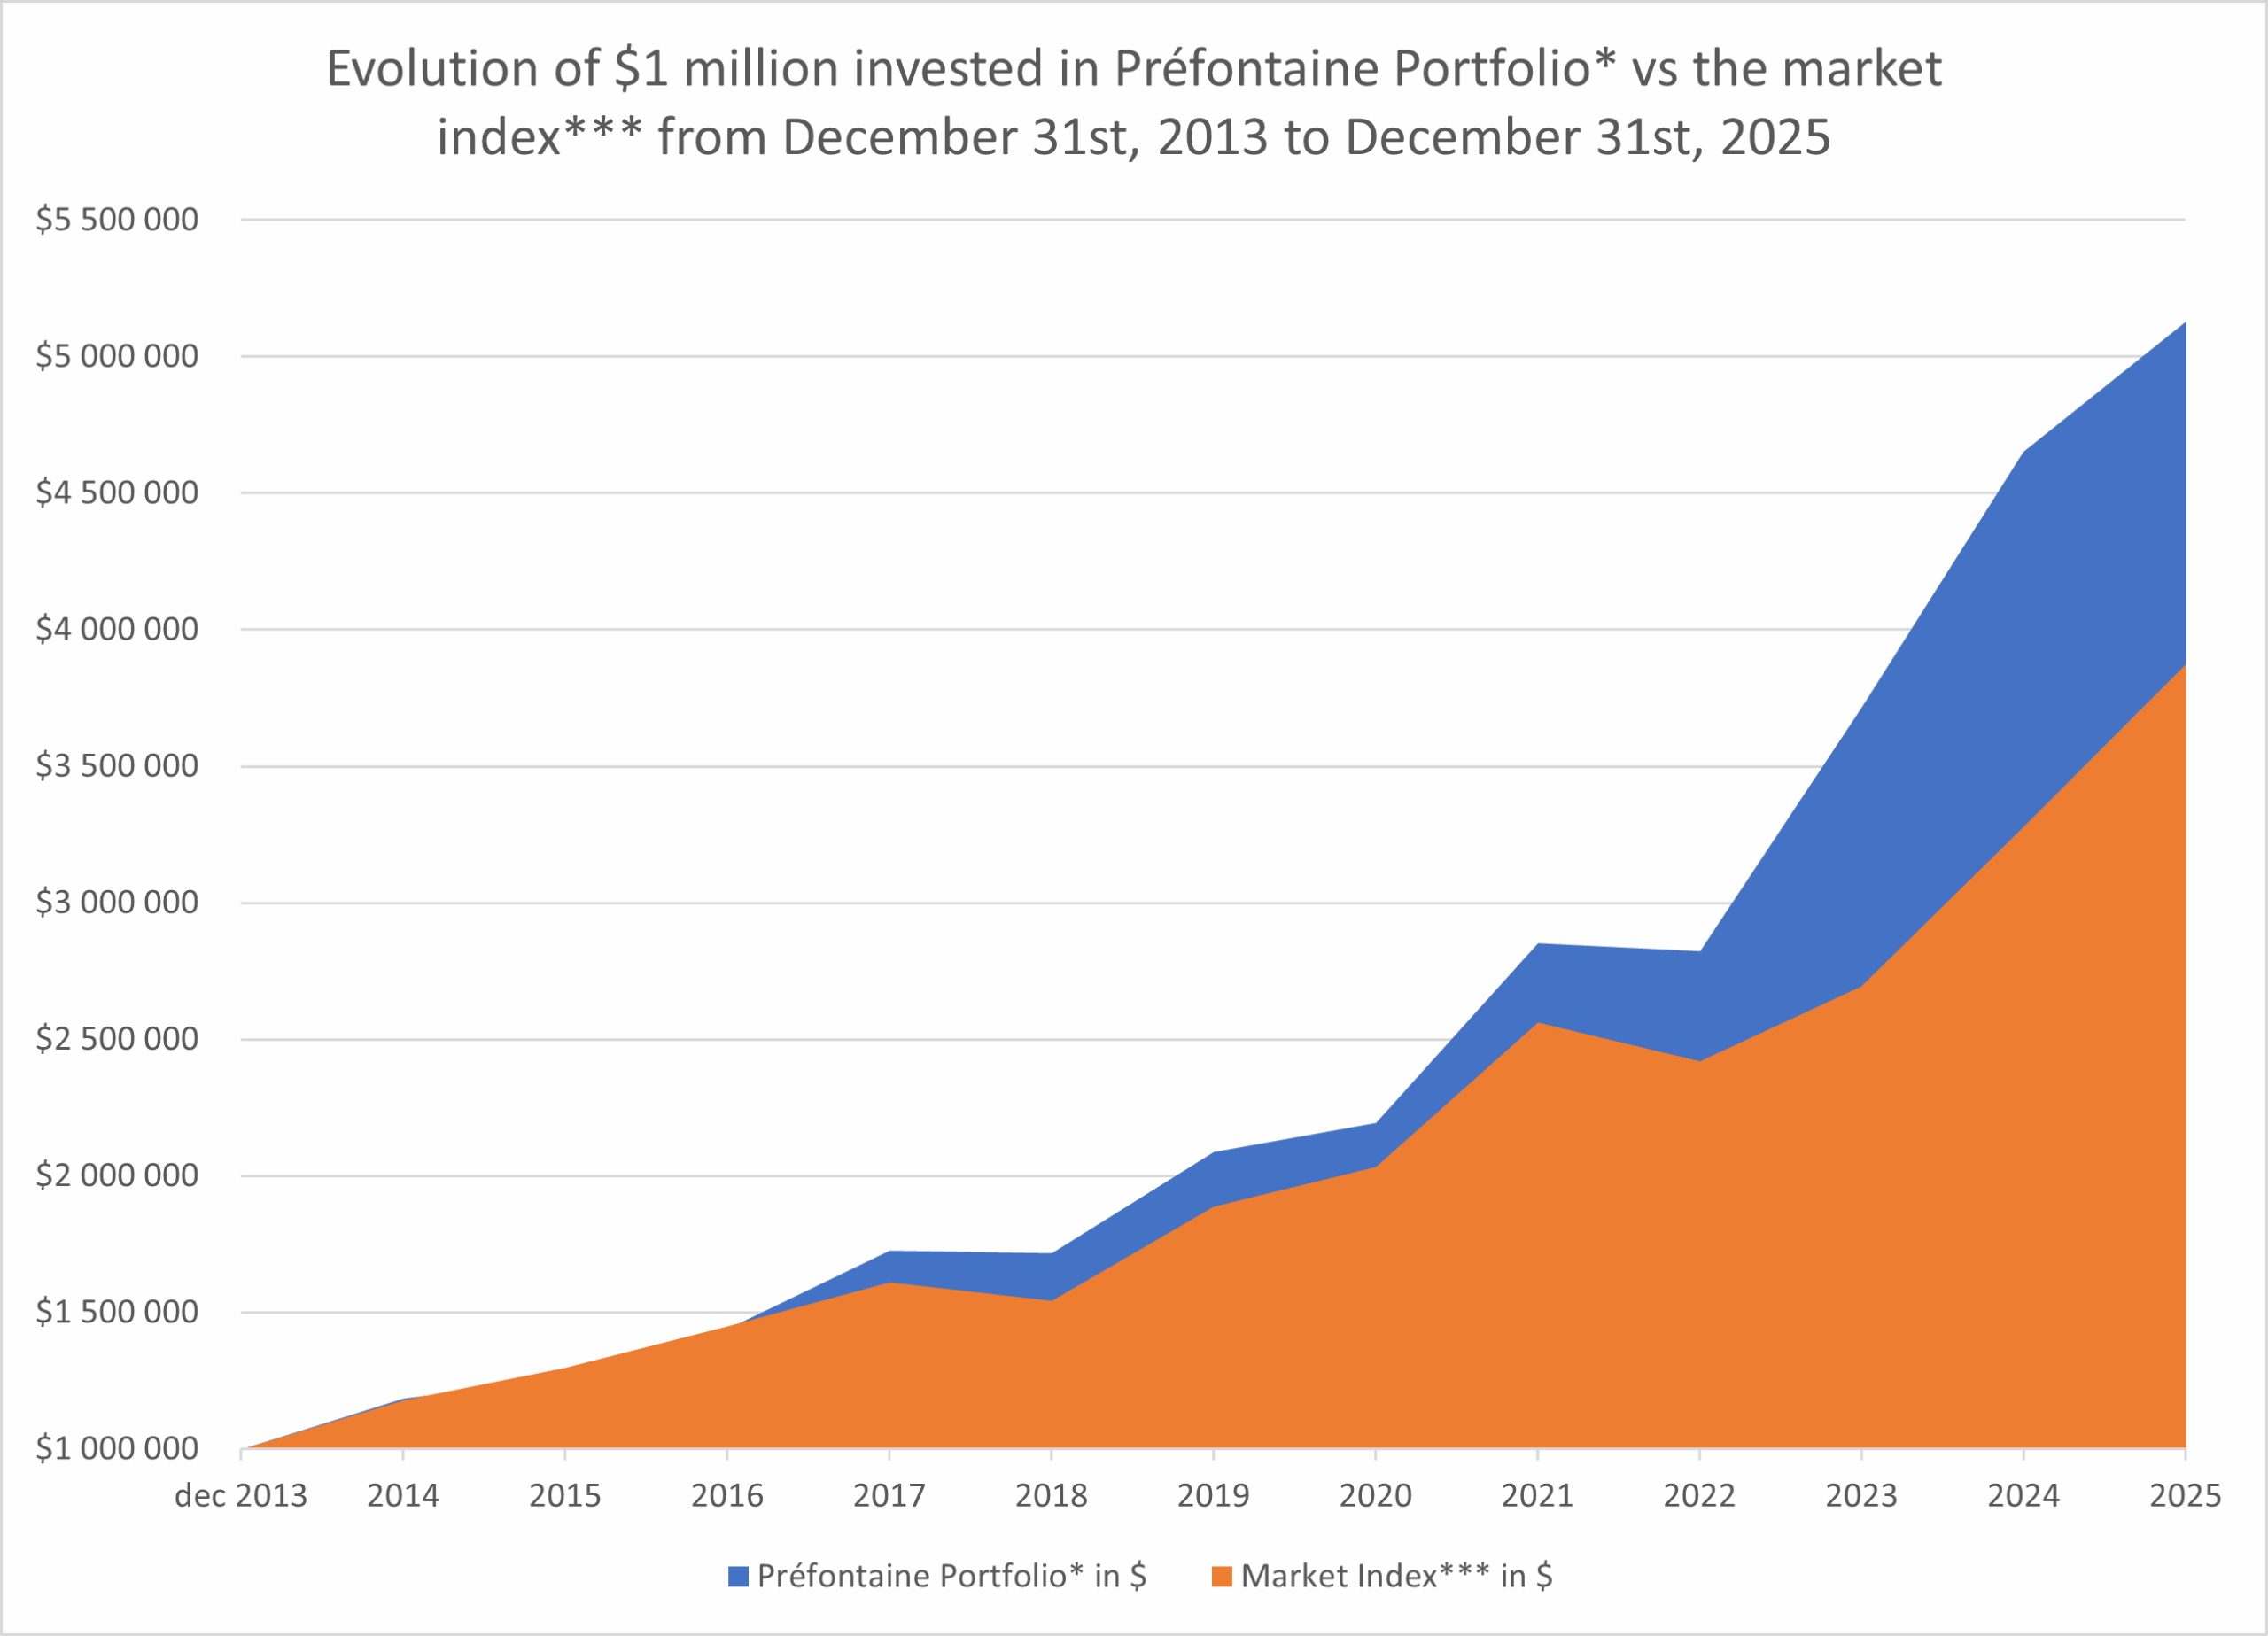
Returns as of December 31st, 2025.
(annualized for periods exceeding one year **).
1yr
3yrs
5yrs
10yrs
Préfontaine Portfolio*
10.3%
22.0%
18.5%
15.1%
Market Index***
18.1%
16.4%
13.6%
11.7%
Difference
-7.8%
5.3%
4.9%
3.4%
Years
Préfontaine Portfolio TR*
Market Index***
Difference
2014
18.4%
17.9%
0.5%
2015
6.3%
10.2%
-3.9%
2016
14.5%
11.8%
2.7%
2017
19.9%
11.1%
8.8%
2018
-0.6%
-4.3%
3.7%
2019
21.6%
22.3%
-0.7%
2020
5.0%
7.8%
-2.8%
2021
30.0%
26.0%
4.0%
2022
-1.0%
-5.6%
4.6%
2023
31.6%
11.4%
20.2%
2024
25.2%
21.7%
3.5%
2025
10.3%
18.1%
Total Cumulative Return (12yrs)
412.9%
287.4%
125.5%
Annualized Return (12yrs)
14.6%
11.9%
2.6%
Past returns do not guarantee future returns.
* The Préfontaine Portfolio is a real portfolio made up of all of Stéphane Préfontaine’s personal and corporate accounts and those of the Préfontaine-Hushion Foundation during the reference period. It is a concentrated portfolio of approximately 20 to 30 common stocks, with no restriction on market capitalization size, economic sector, or geographic location.
** Returns calculated by independent software provider Ndex Systems.
*** The market index includes the equal weighted S&P500 TR (CAD), the Canadian S&P/TSX TR and the MSCI Europe TR (CAD), adjusted annually to reflect the proportions of the Préfontaine Portfolio. These are Total Return (TR) indices, meaning they include dividends. The S&P 500 Equal-Weight Index is the same index of 500 U.S. companies as the S&P500, but the weighting of each stock is rebalanced quarterly to equal 1/500 of the index (0.2%). To give an indication, on December 31st, 2024, the Préfontaine Portfolio was composed of 52.2% U.S. equities, 38.8% Canadian equities and 9.0% European equities.
Comments on returns (as of December 31st, 2025)
Our returns have improved in recent years, helped by experience accumulated over time. An important feature of these returns is their low downside volatility in years of falling stock market indices. We are diligently working on the continuous improvement of our knowledge and processes. We carefully study our mistakes and remain humble in the face of our successes. We believe this attitude will help us improve our returns in the future.
X
X
let's connect
We would be delighted to discuss your needs and objectives